
Powering for equivalence: showing an effect is too small to matter
Source:vignettes/equivalence.Rmd
equivalence.RmdThe claim
Sometimes the research goal is to show an effect is negligible: a cheaper treatment is not meaningfully worse, a feared side effect is not meaningfully present. The equivalence claim succeeds when the whole confidence interval lies inside (-SESOI, +SESOI). A non-significant test is not evidence of absence; a CI inside the equivalence bounds is.
The coherence guard requires |target| < SESOI: you cannot power for equivalence while assuming a true effect on or beyond the bounds.
Power and required n
ape_power(d, n = 2000, claim = "equivalence", sesoi = 0.05,
          nsim = 600, seed = 1)
#> powerape -- equivalence claim (CI within +/-0.050)
#>   probit, n = 2000, assumed true APE +0.0000, 90% CI (alpha = 0.05), nsim = 600
#>   power = 0.628 (MCSE 0.020)
#>   outcomes: minimum 0.000 | detect-only 0.018 | inconclusive 0.353 | equivalence 0.628 | failed 0.000
powerape -- equivalence claim (CI within +/-0.050)
probit, n = 2000, assumed true APE + 0.0000, 90% CI (alpha = .05), nsim = 600
fit: probit via engine(stata), effects(closed)
power = 0.605 (MCSE 0.020)
outcomes: minimum 0.000 | detect-only 0.028 | inconclusive 0.367 | equivalence 0.605 | failed 0.000
ape_n(d, power = 0.80, claim = "equivalence", sesoi = 0.05,
      nsim = 500, seed = 2)
#> powerape required sample size -- equivalence claim
#>   n = 2705 for 80% target power (confirmed 0.805, MCSE 0.009)
#>   assumed true APE +0.0000, sesoi 0.050, 90% CI (alpha = 0.05), probit
#>   search: 1 step(s); confirmed in 1 round(s) at nsim = 2000.
powerape required sample size -- equivalence claim
n = 2705 for 80% target power (confirmed 0.799, MCSE 0.009)
assumed true APE + 0.0000, sesoi 0.050, 90% CI (alpha = .05), probit
fit: Mata engine (Fisher scoring)
search: 1 step(s); confirmed in 1 round(s) at nsim = 2000.Equivalence needs the CI to be narrow, not just centered near zero, so sample sizes are driven entirely by the SESOI: halving the SESOI roughly quadruples the required n.
cv <- ape_curve(d, n = seq(500, 3500, by = 750), claim = "equivalence",
                sesoi = 0.05, nsim = 300, seed = 3)
plot(cv, target_power = 0.80)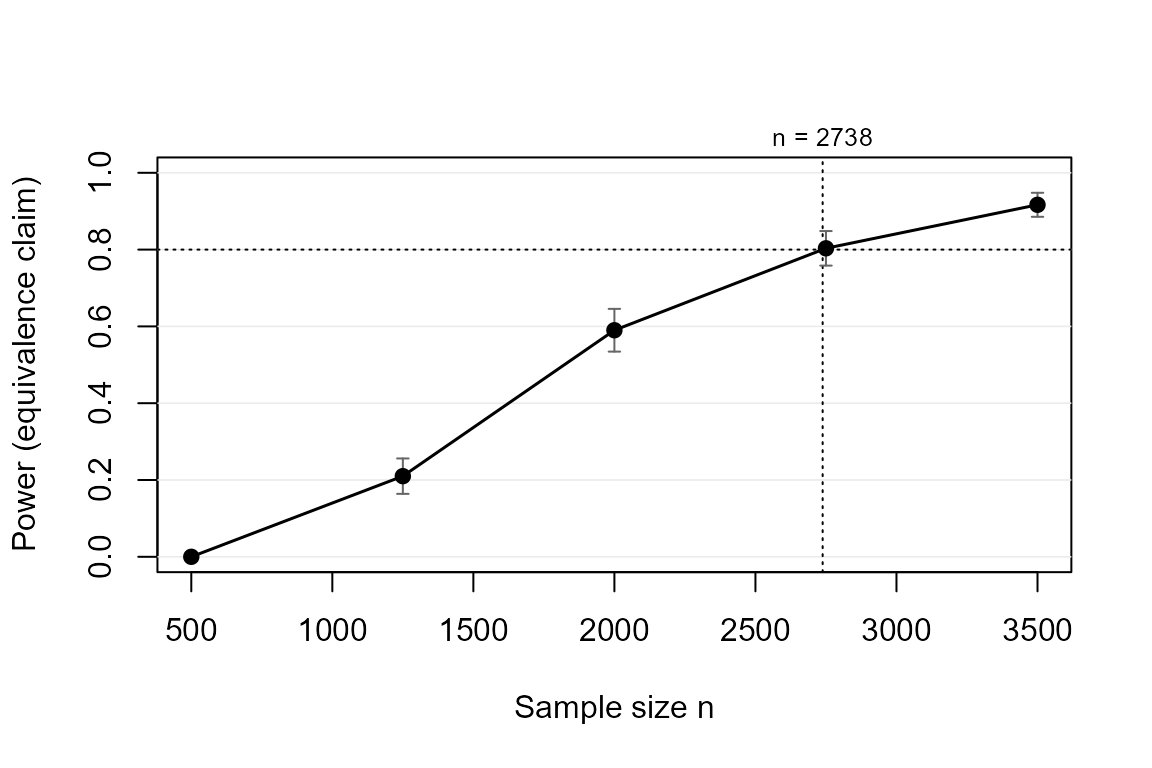
powerape curve d, n(500(750)3500) claim(equivalence) sesoi(0.05)         ///
    nsim(300) seed(3) engine(mata)

matrix C = r(results)
svmat C, names(col)
twoway connected power n, yline(0.8, lpattern(dash))                      ///
    ytitle("Power") xtitle("Sample size") ylabel(0(0.2)1)
powerape power curve -- equivalence claim, probit (APE), nsim = 300 per point
fit: Mata engine (Fisher scoring)
n alpha power mcse failed separated
500 0.0500 0.0000 0.0000 0.0000 0.0000
1250 0.0500 0.2800 0.0259 0.0000 0.0000
2000 0.0500 0.5867 0.0284 0.0000 0.0000
2750 0.0500 0.7933 0.0234 0.0000 0.0000
3500 0.0500 0.8767 0.0190 0.0000 0.0000
A robustness note
The width of the CI for an APE depends on the baseline rate (binomial
variance peaks at 0.5), so equivalence power inherits that dependence.
ape_robust() makes it visible:
ape_robust(d, n = 2600, claim = "equivalence", sesoi = 0.05,
           vary = list(baseline = c(0.20, 0.50)), grid_points = 3,
           nsim = 300, seed = 4, nmax = FALSE)
#> powerape robustness sweep -- equivalence claim, APE, pin = ape
#>   n = 2600, nsim = 300 per scenario, 3 scenario(s) over: baseline
#>   power range [0.703, 0.903]; worst scenario:
#>  baseline implied_effect     power       mcse separated
#>       0.5              0 0.7033333 0.02637269         0
#>   scenarios:
#>  baseline implied_effect     power       mcse separated
#>      0.20              0 0.9033333 0.01706089         0
#>      0.35              0 0.7233333 0.02582778         0
#>      0.50              0 0.7033333 0.02637269         0
powerape robust d, n(2600) claim(equivalence) sesoi(0.05) ///
vary(baseline(0.20 0.50)) gridpoints(3) nsim(300) seed(4) nonmax engine(mata)powerape robustness sweep -- equivalence claim, APE, pin = ape
n = 2600, nsim = 300 per scenario, 3 scenario(s) over: baseline
power range [0.663, 0.900]; worst scenario: row 3
fit: Mata engine (Fisher scoring)
row baseline implied_eff power mcse separated
1 .2 0.0000 0.9000 0.0173 0.0000
2 .35 0.0000 0.7200 0.0259 0.0000
3 .5 0.0000 0.6633 0.0273 0.0000Reporting
power_statement() works for equivalence designs too, and
states the error-rate convention explicitly: the equivalence claim is a
TOST at alpha = .05, read off the 90% interval (Lakens,
2017; Riesthuis, 2024), the same convention TOSTER uses. The
conservative alternative of a 95% interval (a TOST at 2.5%) is available
via conf = 0.95.
pw <- ape_power(d, n = 2600, claim = "equivalence", sesoi = 0.05,
                nsim = 500, seed = 5)
power_statement(pw)
#> We conducted a simulation-based power analysis for the average partial effect
#> (APE) of treat using the powerape package (version 1.11.4), following the
#> confidence-interval approach of Riesthuis (2024). The assumed data-generating
#> process was a probit model with focal variable treat (binary, prevalence
#> 0.50); parametric covariates age (continuous, mean 45, SD 12), with the focal
#> variable and the covariates mutually independent; baseline outcome rate 0.300
#> with the focal at reference; nuisance covariates contribute a latent
#> pseudo-R-squared of 0.10. The assumed true APE was 0.000 (0.0 percentage
#> points). At a sample size of n = 2600, simulated power for the equivalence
#> claim (the 90% confidence interval lying within +/-0.050; two one-sided tests
#> at alpha = 5%) was 0.764 (Monte Carlo SE 0.019; 500 replications). Across
#> replications, the probability of concluding a meaningful effect was 0.000, of
#> detection without meaningfulness 0.018, of an inconclusive result 0.218, and
#> of equivalence 0.764. Estimation used maximum likelihood with delta-method
#> Wald confidence intervals; replications without a maximum-likelihood
#> estimate, from a failed fit or from separation (a focal cell with no events
#> or no non-events), counted against the claim (0.0% of replications).
powerape -- equivalence claim (CI within +/-0.050)
probit, n = 2600, assumed true APE + 0.0000, 90% CI (alpha = .05), nsim = 500
fit: probit via engine(stata), effects(closed)
power = 0.758 (MCSE 0.019)
outcomes: minimum 0.000 | detect-only 0.024 | inconclusive 0.218 | equivalence 0.758 | failed 0.000
We conducted a simulation-based power analysis for the average partial effect
(APE) of treat using the powerape package for Stata (version 0.1.3 (Stata port
of powerape 1.11.3)), following the confidence-interval approach of Riesthuis
(2024). The assumed data-generating process was a probit model with focal
variable treat (binary, prevalence 0.50); parametric covariates age
(continuous, mean 45, SD 12), with the focal variable and the covariates
mutually independent; baseline outcome rate 0.300 with the focal at reference;
nuisance covariates contribute a latent pseudo-R-squared of 0.10. The assumed
true APE was 0.000 (0.0 percentage points). At a sample size of n = 2600,
simulated power for the equivalence claim (the 90% confidence interval lying
within +/-0.050; two one-sided tests at alpha = 5%) was 0.758 (Monte Carlo SE
0.019; 500 replications). Across replications, the probability of concluding a
meaningful effect was 0.000, of detection without meaningfulness 0.024, of an
inconclusive result 0.218, and of equivalence 0.758. Estimation used maximum
likelihood with delta-method Wald confidence intervals; replications without a
maximum-likelihood estimate, from a failed fit or from separation (a focal
cell with no events or no non-events), counted against the claim (0.0% of
replications).