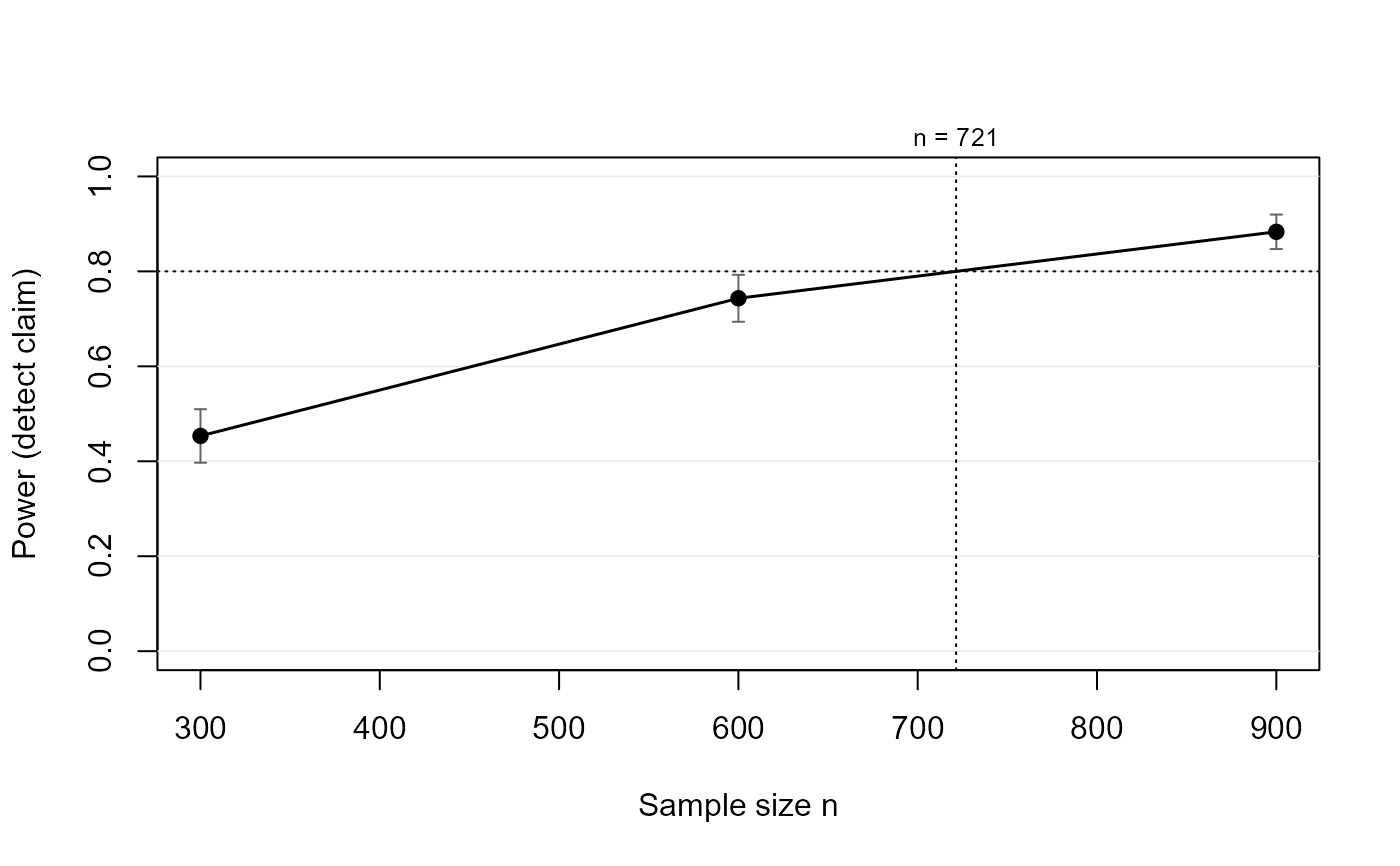
Runs the power simulation at each element of n and collects the
results. Works for APE and AIE designs alike.
Arguments
- dgp
- n
Integer vector (length >= 2) of total sample sizes.
- claim
"minimum"(default),"detect", or"equivalence".- sesoi
Smallest effect size of interest, in APE units. Required for
"minimum"and"equivalence"; optional for"detect"(if supplied, the outcome table is still broken out against it).- alpha
The claim's error rate (default 0.05): two-sided for
"detect", one-sided for"minimum", TOST for"equivalence". May also be a sample-size rule: a function ofnreturning the error rate to use at thatn, for examplefunction(n) alphaN::alphaN(n, BF = 3), the Bayes-factor calibration of Wulff and Taylor (2024) that lowers alpha asngrows. The searching functions evaluate the rule at every candidaten, soape_n()designs jointly over the pair (alpha(n), n); results store the rule and the level it produced.- conf
Optional override: the interval level used for the claim itself (
1 - alphafor detection,1 - 2 alphaotherwise). Supplyingconf = 0.95for a minimum-effect or equivalence claim reproduces the pre-1.8.0 behavior (one-sided error rate 2.5%).- nsim
Replications per grid point.
- seed
Optional; grid point i uses
seed + i - 1.- se
Standard errors for the exogenous cross-sectional routes:
"model"(default, expected-information ML) or"robust"(heteroskedasticity-robust HC0 sandwich, as in the sandwich package). Panel designs always use unit-clustered SEs and IV designs the stacked method-of-moments robust sandwich;seis ignored there.- separation
How simulated studies with separation in an identifying cell are scored:
"fail"(default; counted as failed, as the field's reference analysis refuses them) or"keep"(retained with their degenerate Wald intervals). See the section 'Separation and sparse cells'.- x
A
powerape_curveobject.- target_power
Optional horizontal reference line; when the curve crosses it, the crossing n is marked and annotated.
- ...
Passed to the base plot call.