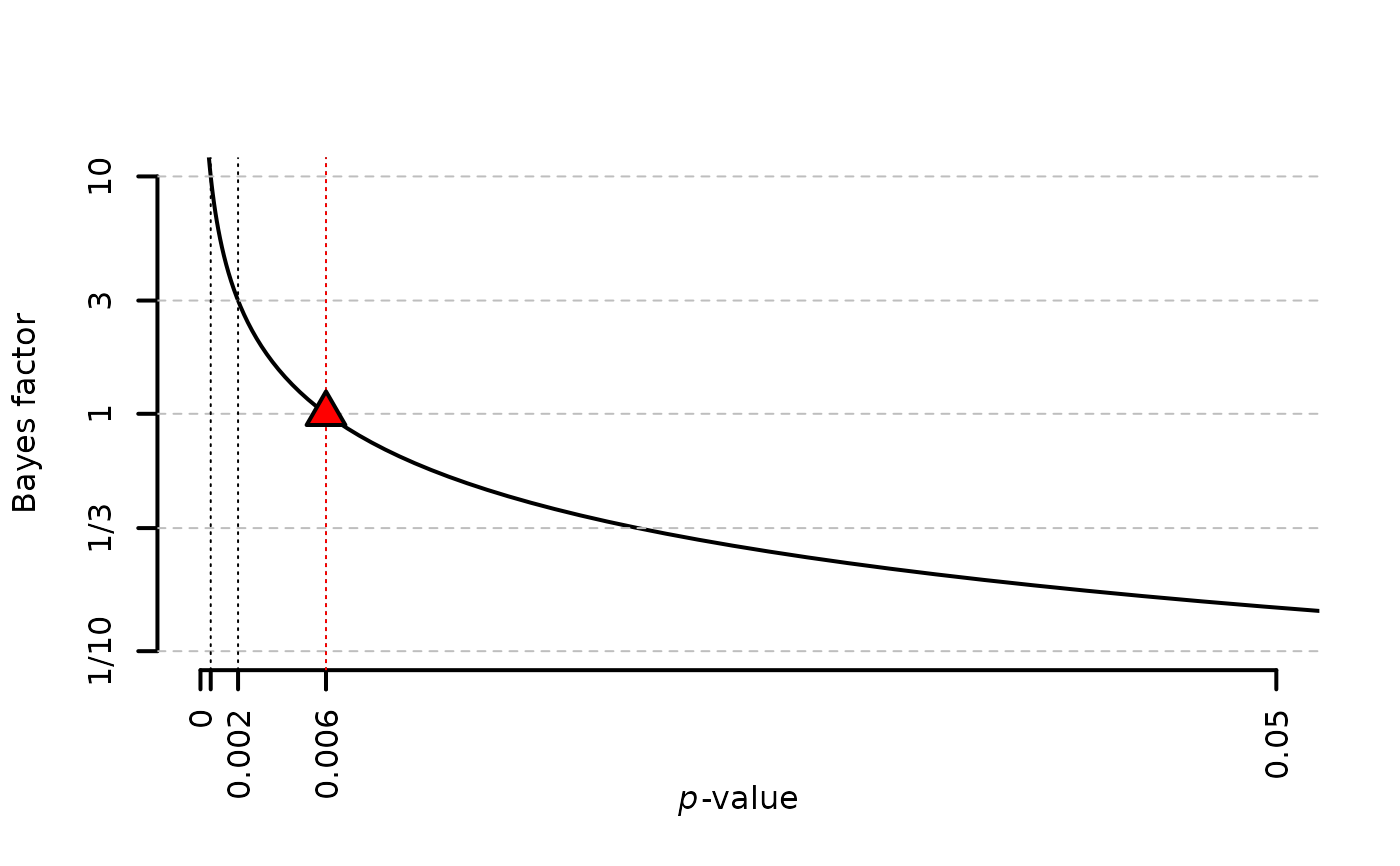
Plots JAB as a function of the p-value
Arguments
- n
Sample size. A positive numeric vector.
- BF
Bayes factor you would like to match. 1 to avoid the Lindley Paradox, 3 to achieve moderate evidence and 10 to achieve strong evidence.
- method
Used for the choice of 'b'. Currently one of:
"JAB": this choice of b produces Jeffreys' approximate BF (Wagenmakers, 2022)
"min": uses the minimal training sample for the prior (Gu et al., 2018)
"robust": a robust version of "min" that prevents too small b (O'Hagan, 1995)
"balanced": this choice of b balances the type I and type II errors (Gu et al., 2016)
- upper
The upper limit for the range of realistic effect sizes. Only relevant when method="balanced". Defaults to 1 such that the range of realistic effect sizes is uniformly distributed between 0 and 1, U(0,1).